LABSYS-Evo User Report
Abstract
In this report, we present results of key measurements performed using the Labsys Evo instrument. As we are beginning to develop our expertise in this field, we report here the results of some experiments whose data seemed inaccurate according to our knowledge and the scientific literature. We were able to explain and quantify certain phenomena like the apparent mass fluctuation with temperature, the role of oxygen on the accuracy of the heat-flow measurements as well as the non-flat heat flow signals from DTA, DSC and Cp blank measurements.
1. Introduction
The history of thermal analysis began more than a century ago, with Le Chatelier’s 1887 experiment designed to measure the heating curve of clay minerals. During this long history, many techniques have been developed. Indeed, Differential Thermal Analysis (DTA) was invented by Roberts-Austen in 1899 [1] by introducing an inert reference material and measuring the temperature difference between the sample and the reference. This technique was initially developed for metallurgical applications but has proved to be very valuable for many different materials. Later, ThermoGravimetry Analysis (TGA) was developped in 1915 by Honda [2] and was initially dedicated to inorganic materials. More recently, Mike O’Neill [3] developped the first power-compensated Differential Scanning Calorimetry (pc-DSC) in order to measure the heat-flow difference between a sample and a reference. Few years later, the heatflux DSC (hf-DSC) was developed [4]. At this time, the technique was mainly devoted to the analysis of polymers. Another important milestone has been reached with the recent developments in temperature modulated differential scanning calorimetry (TM-DSC) [5]. TMDSC consists of using two simultaneous heating rates – a linear heating rate that provides information similar to the conventionnal DSC and a sinusoidal heating rate that allows simultaneous measurement of the heat capacity of the sample. Thus, using Fourier transformations, TMDSC allows measuring the total heat flow and the heat capacity contribution to the total heat flow. In addition, this technique allows to study transformation kinetics such as glass transition kinetics [6].
Nowadays, TGA, DTA and DSC present a wide range of applications; these methods allow the study of dehydration [7, 8], drying [9, 10], adsorption and desorption [11, 12], oxidation [13, 14], measurements of the enthalpy of phase transformations [15, 16], heat capacity [17, 18] as well as the construction of phase diagrams (via the analysis of thermal arrests)[19, 20] which are reference tools for metallurgists.
It is also important to note that TGA, DTA and DSC techniques can be used for many materials such as minerals [21], metals [22], organic substances [23], ceramics [24] as well as refractory materials [25]. The main challenge in studying high temperature melting materials lies in the material selection to construct the inside of the furnace to prevent its thermal degradation and chemical interaction with the volatile elements that may evolve from the samples. A similar challenge exists when selecting the best crucible to contain these materials.
Although numerous articles deal with the applications of these techniques, relatively few publications are devoted to the key steps required to perform accurate measurements. Moreover, experienced experimenters are no longer the only ones using these devices and often the only preparation available to new experimenters is reading the user manual. Even considering the detailed ASTM standards for temperature and heat flow calibration of TG, DTA, and DSC [26{28], it can be difficult for a novice experimenter to interpret particular behaviors.
In this report, we conducted several experiments using all the techniques available with the LABSYSEvo device. Some of our results may seem unusual to beginner users and are difficult to explain and interpret. Unfortunately, little information is available in the literature to validate these results. Here are some examples:
- We obtained non-flat heat-flow and mass signals which were reproducible during heating and cooling runs for experiments conducted with no crucibles placed on our probes.
- We also calculated the standard deviation of cyclic fusion enthalpy measurements (20 measurements) for five pure metals. The twenty measured values of the fusion enthalpy of Ag and Pb are close to each other, while the values measured with Al decrease steadily over the cycles. Thus, these experiments suggest that the greater the affinity of the sample for oxygen, the greater the standard deviation. Just note that argon atmosphere was used to purge and protect the furnace chamber. Moreover, no sample mass change have been measured.
- At last, we reported an important limitation of the DSC rod measurements resulting from the shape of the used sample. This limitation has been discussed by Blanco [29] among others and we show in this report that different sample shapes may lead to very different enthalpy of fusion measurements for comparable sample masses.
2. Limitations of the measurements
2.1. Heat flow signal from blank measurement
In Fig. 1 to Fig. 3, we have reported the blank measurements performed with the TG-DTA rod, the TG-DSC rod and the Cp rod, respectively, with various heat rate, from room temperature to maximum temperatures 1600 ◦C, 1600 ◦C and 1100 ◦C, respectively. Just note that we do not use any numerical treatment (no temperature and heat flow calibration) and these measurements were performed without any samples or crucibles. The measurements reported in this section were performed without any crucibles. Similar heat flow signals were obtained with empty crucibles.
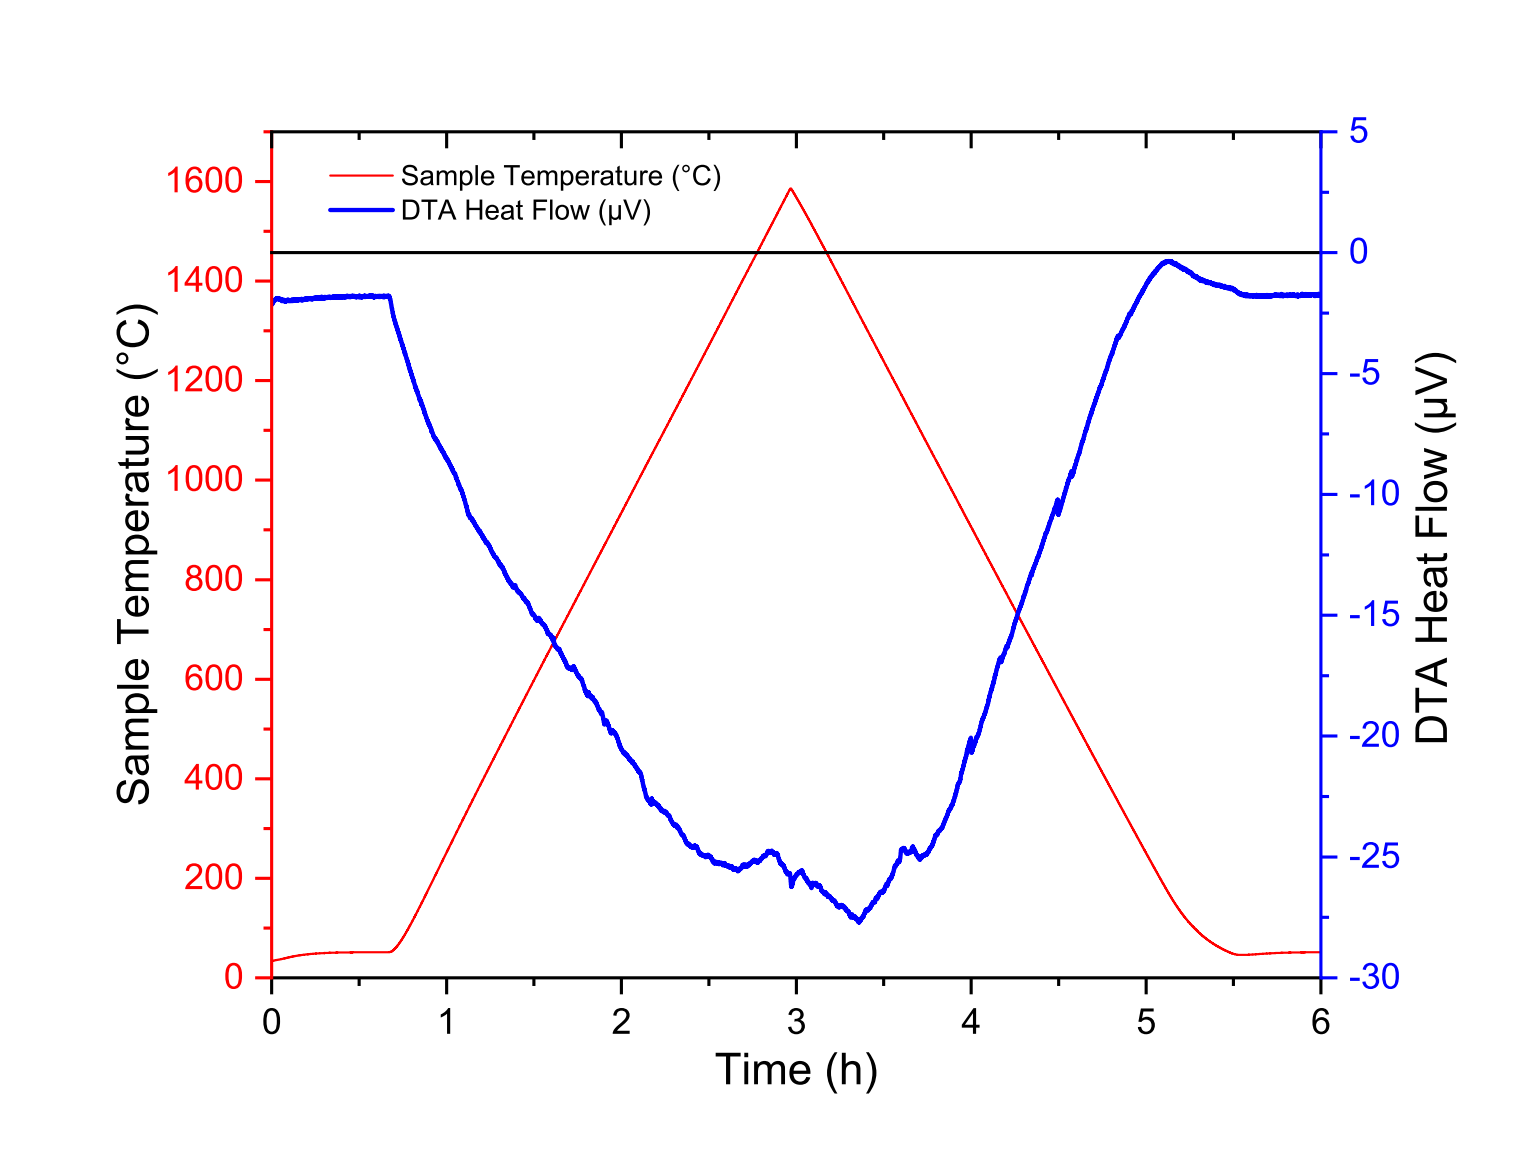 Figure 1: Raw data from blank measurement of the DTA rod up to 1600 ◦C
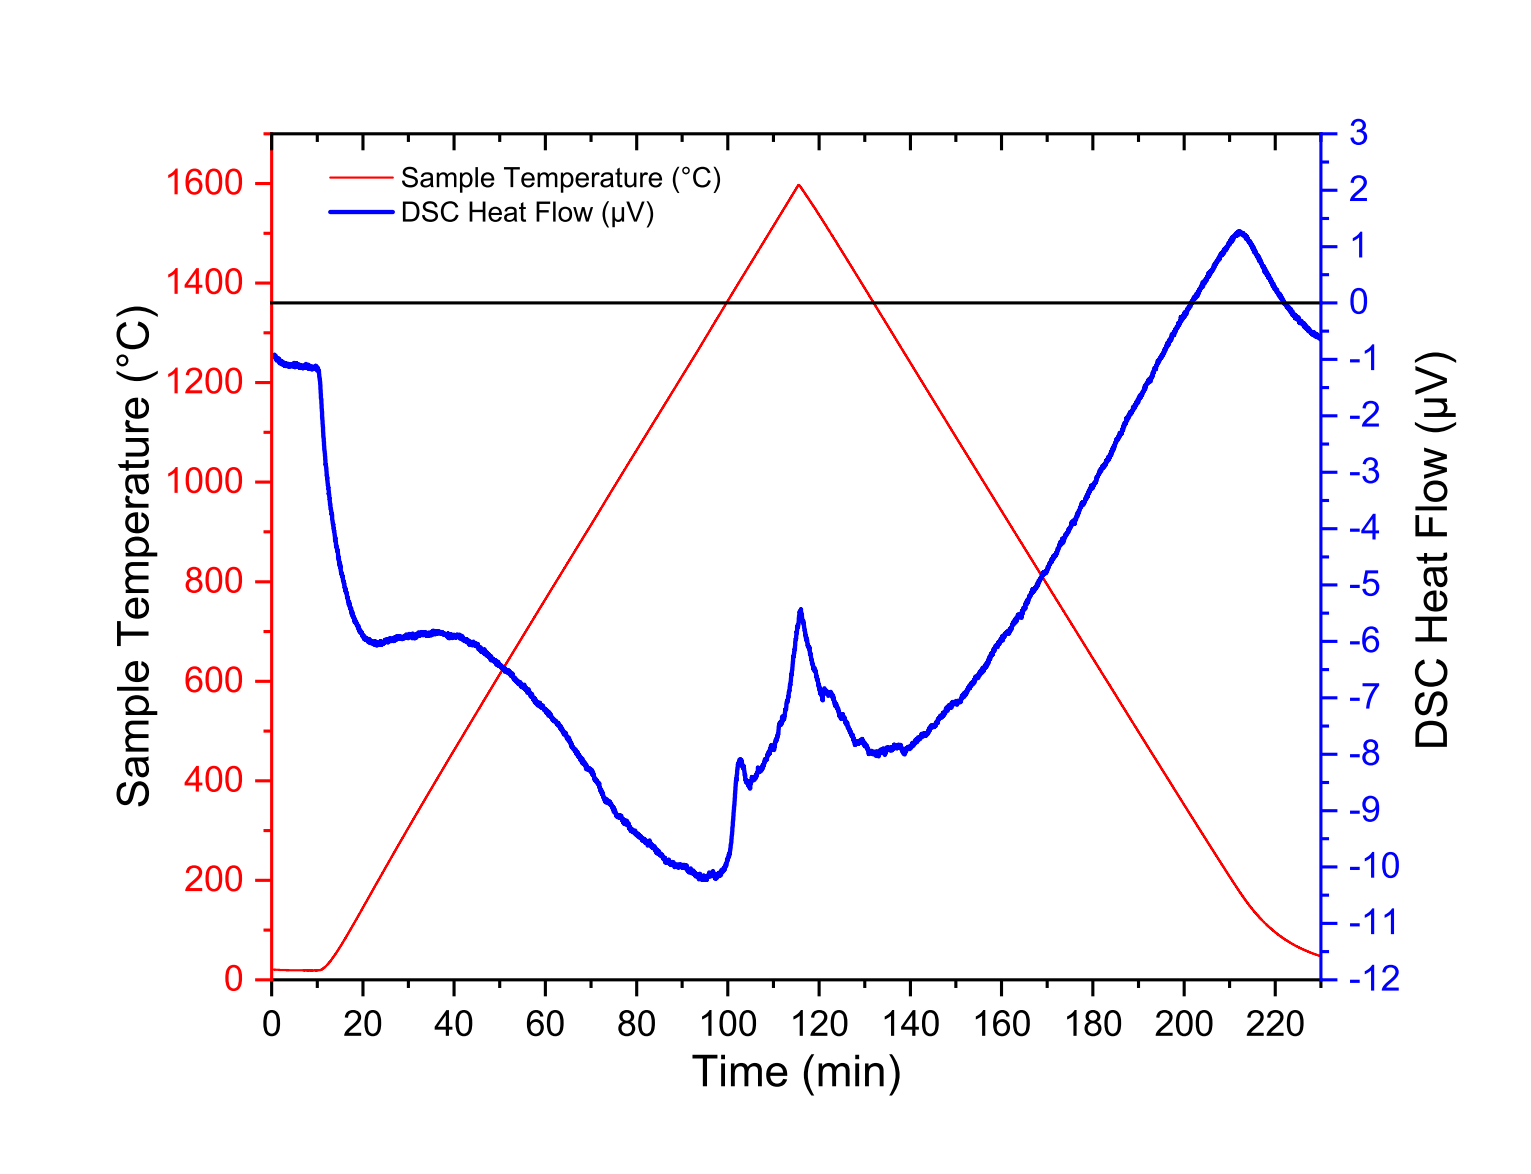
Figure 2: Raw data from blank measurement of the DSC rod up to 1600 ◦C 
Figure 3: Raw data from blank measurement of the Cp rod up to 1100 ◦C
In Fig. 4, we have reported the blank measurement of the Cp rod, with a 10h-plateau at 1500 ◦C following by heating up to 1600 ◦C then cooling down to room temperature.
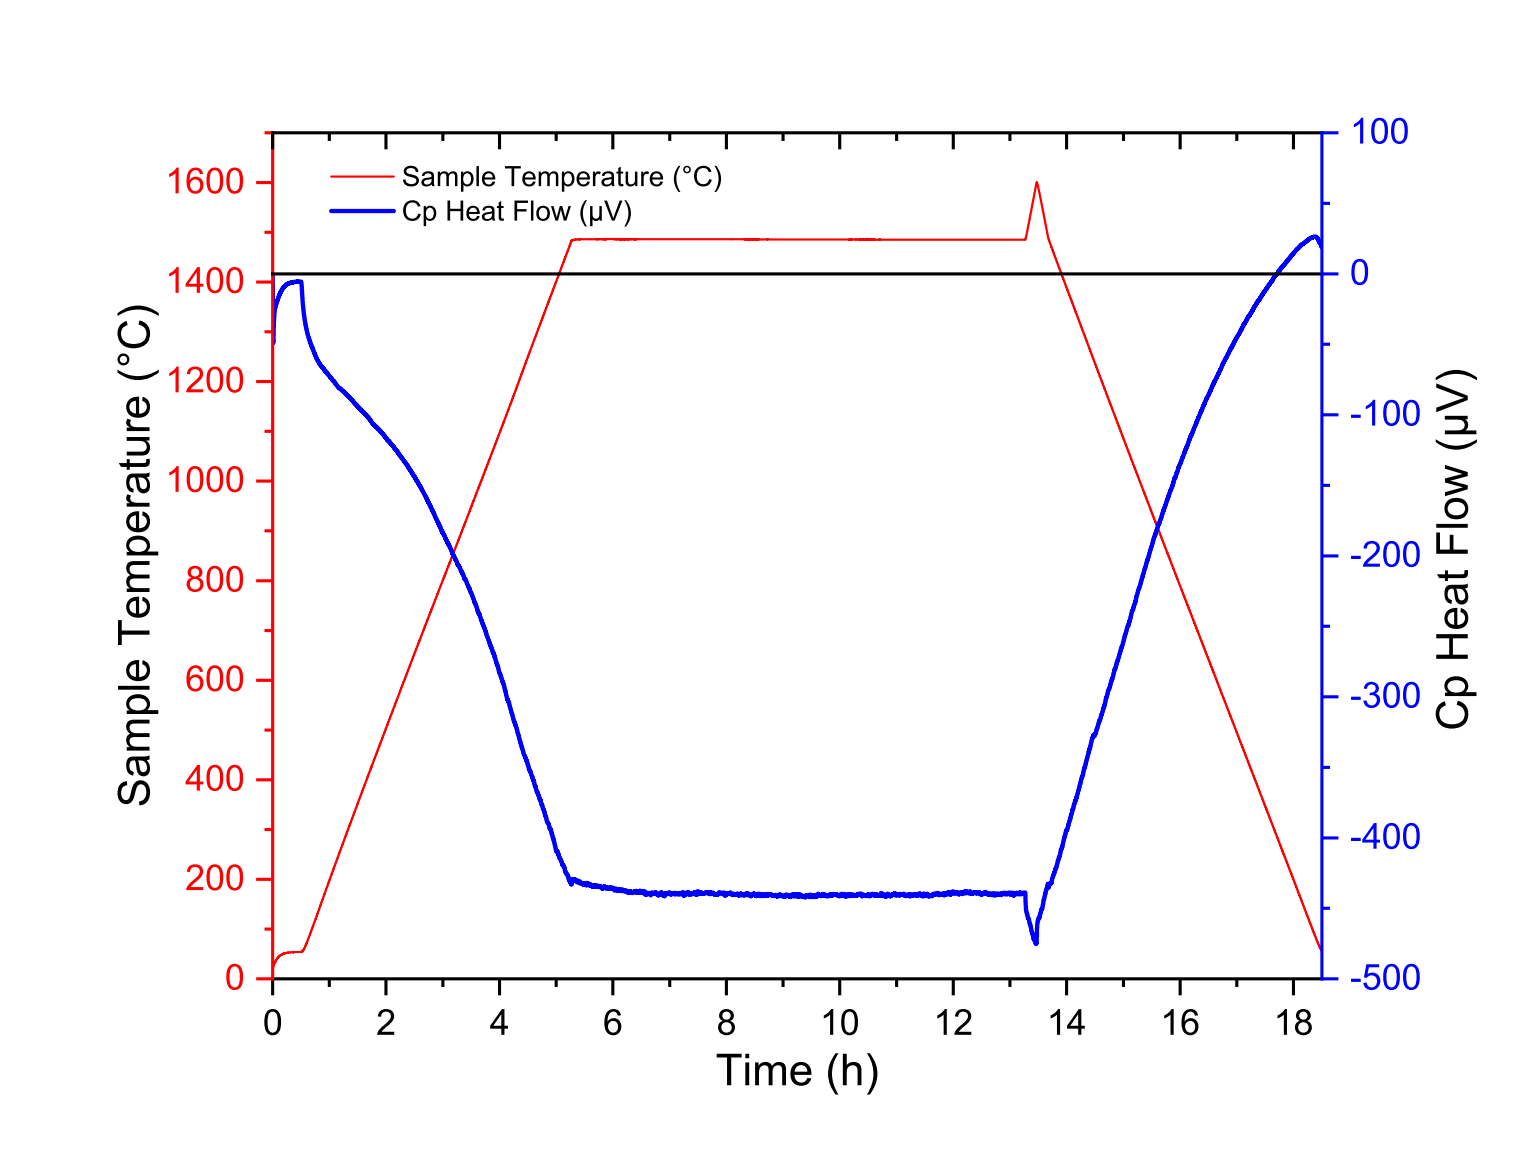
Figure 4: Raw data from blank measurement of the Cp rod up to 1600 ◦C, with a 1500 ◦C plateau for ten hours
To explain these signals, it should be noted that the reference and sample thermocouples are not perfectly symmetrical. Thus, the raw output signals of reference and sample thermocouples are not identical for a given temperature. In addition, it should be noted that the centering of the Cp rod should be carried out in such a way that the temperature variations of the rod are as homogeneous as possible.
2.2. Mass balance signal
In Fig. 5, we have reported the blank measurement performed with the TG-DSC rod. Similarly to the measurements presented in Section 2, the experiment reported in Fig. 5 was conducted with no numerical treatment, no samples and no crucibles.
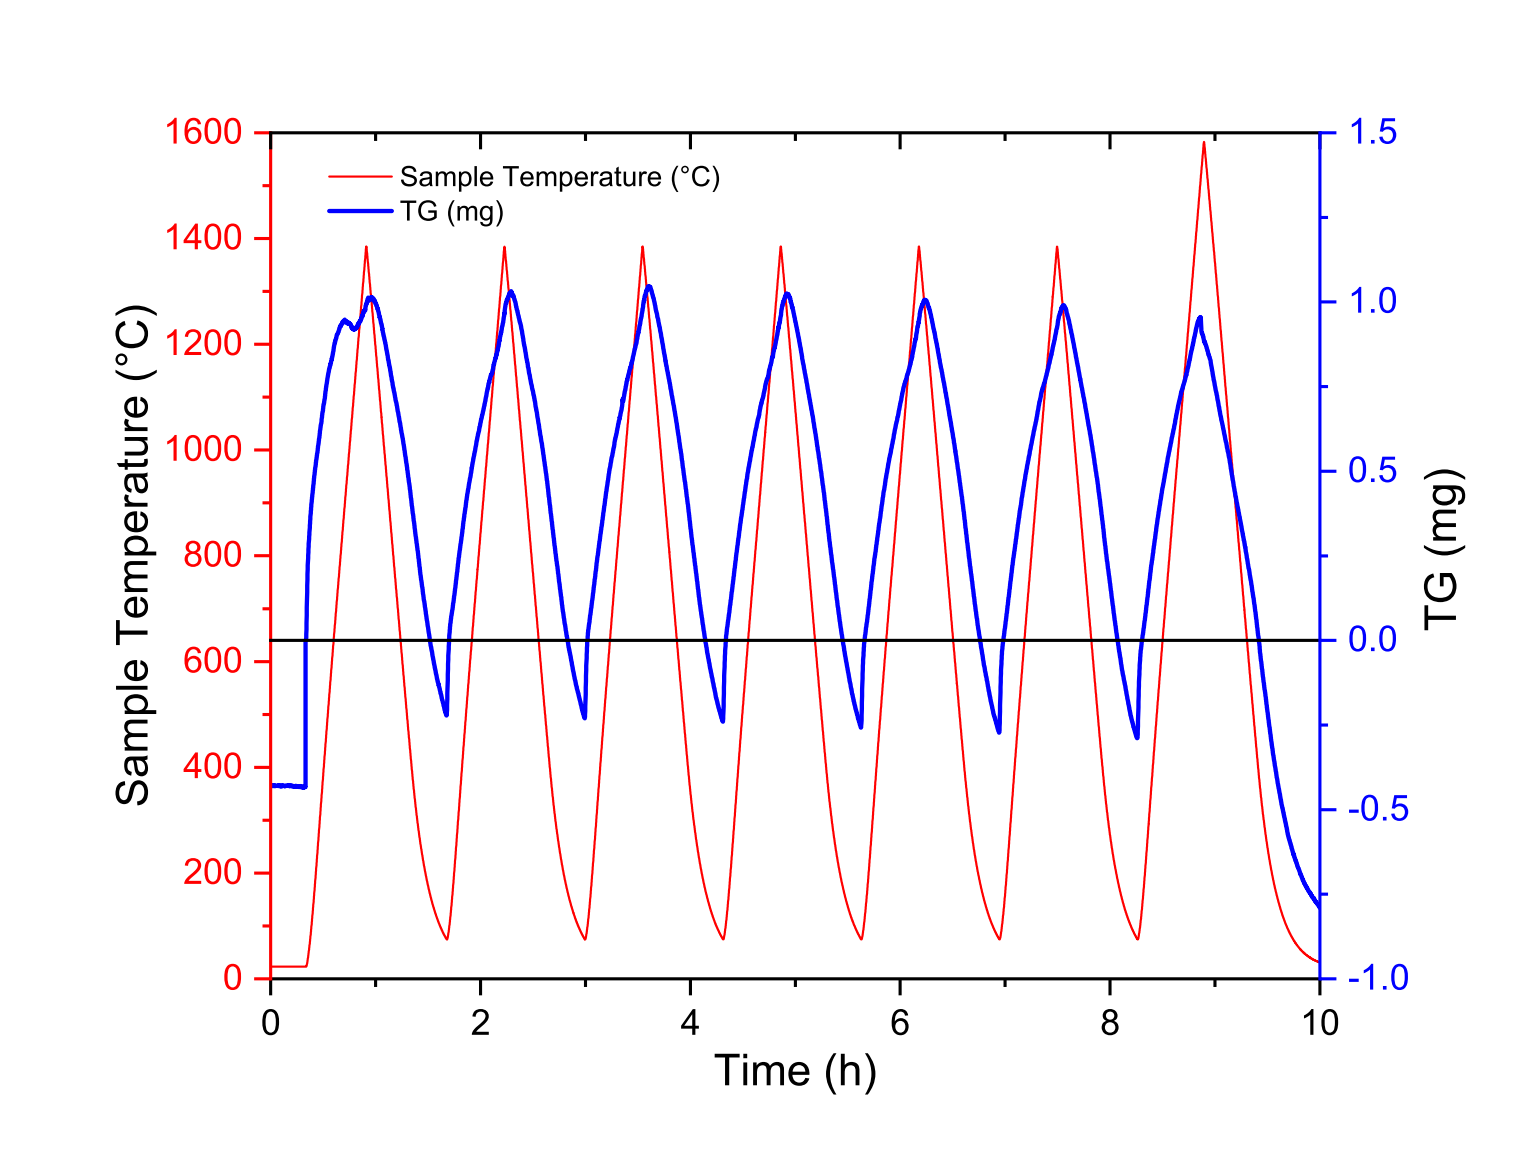
Figure 5: TG (mg) raw data from blank measurement of the DSC rod up to 1600 ◦C
It should be noted that the signal mass of the rod increase with increasing temperature and decrease with decreasing temperatures which can seems counter-intuitive. The rod and the crucibles are subjected to a buoyancy force [30], proportionate to the weight force of the fluid volume displaced. The norm of the buoyancy force Π is expressed as:

with ρgaz the volumetric mass of the gas, Vrod and Vcrucibles the volumes of the rod and crucibles, respectively, and g the gravity constant. Using the ideal gas law, the norm of the buoyancy force can be written as:

with Pgas, Mgas and Tgas the pressure, molar mass and temperature of the gas, respectively. R is the ideal gas constant. Thus, the buoyancy force decrease for increasing temperature that leads to an increase of the mass signal.
The buoyancy force can be partially compensated by the frictional force induced by the viscosity of the flowing gas [31]. The frictional force Ffrictional is expressed as:

χ is a geometrical factor, T0 and P0 are the normal temperature and pressure, νgas is the viscosity of the gas, ρ0 is the volumetric mass of the gas in standard conditions, φ is the gas flow.
A numerical correction could be done simply knowing the volume of each rod and crucibles as well as their variation with temperature as well as the geometrical factor of each rod as a function of the viscosity and its variation with temperature.
2.3 Oxygen affinity
Highlighting the role of oxygen affinity on the accuracy of DSC measurements is tricky. To do this, we have carried out cyclic measurements of the melting temperature and enthalpy of fusion of five elements commonly used as pure element standards for temperature and heat-flow calibration: Sn, Pb, Zn, Al, Ag. No numerical processing was used for these experiments. Note that the initial and final temperatures were set at 120K below and above the melting point of each pure element, respectively. After the first melting which is not taken into account, the samples were melted twenty times, five times for each heating rate from 5K/min to 20 K/min with a 5K/min step. At last, note that the mass of each sample was measured before and after each experiment with a precision balance (0.1 mg tolerance). No mass variation was measured.
We have reported in Table 1, the twenty raw values of the fusion enthalpy (in µV:s:mol-1) measured for each pure element as well as the associated standard deviation. In Fig. 6, we have plotted the standard deviation reported in Table 1 with respect to the absolute value of the Gibbs free energy of the most stable oxidation reaction calculated at the melting temperature of each pure element. These are the reactions of the formation of SnO2, Pb3O4, ZnO and Al2O3:


These calculations were performed by means of the FactSage software [32].
Table 1: Raw values of the fusion enthalpy (in µV:s:mol-1) and their standard deviation (STD) for Ag, Pb, Sn, Zn and Al pure elements
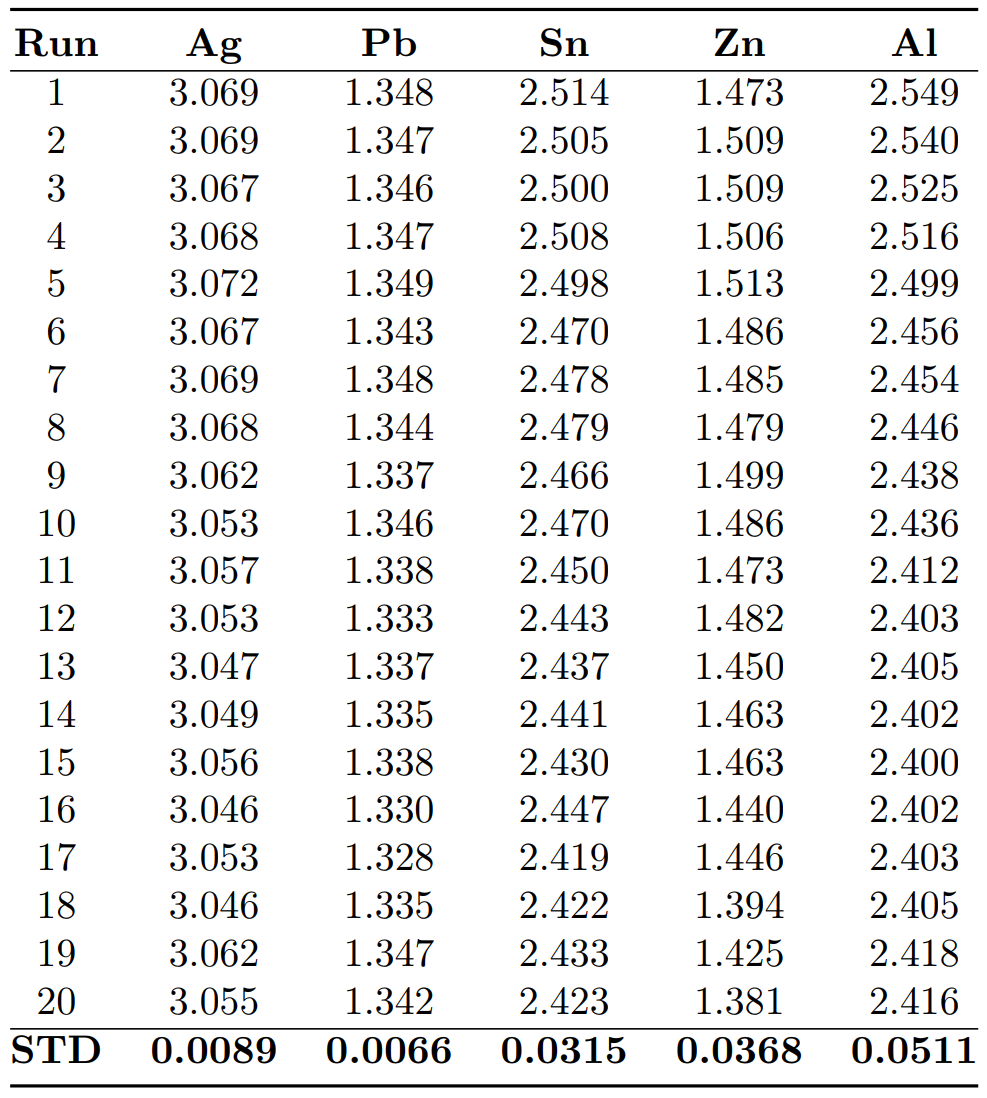
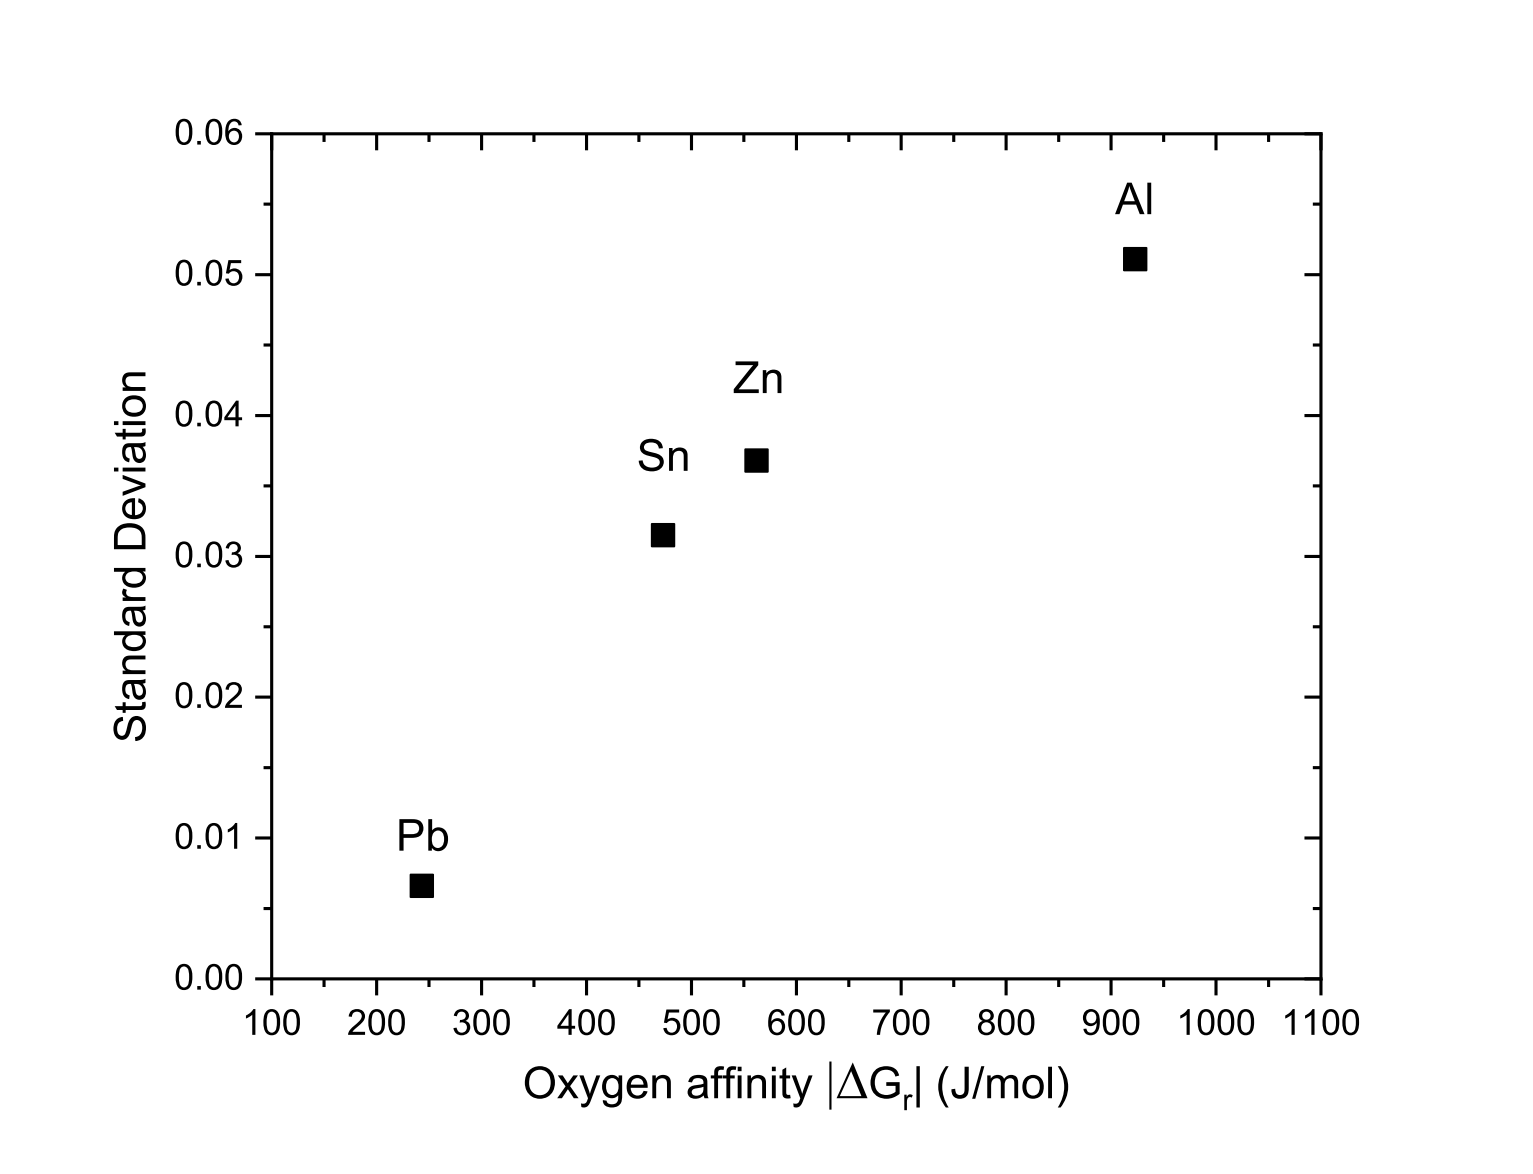
Figure 6: Standard deviation of fusion enthalpy measurements as function of oxygen affinity
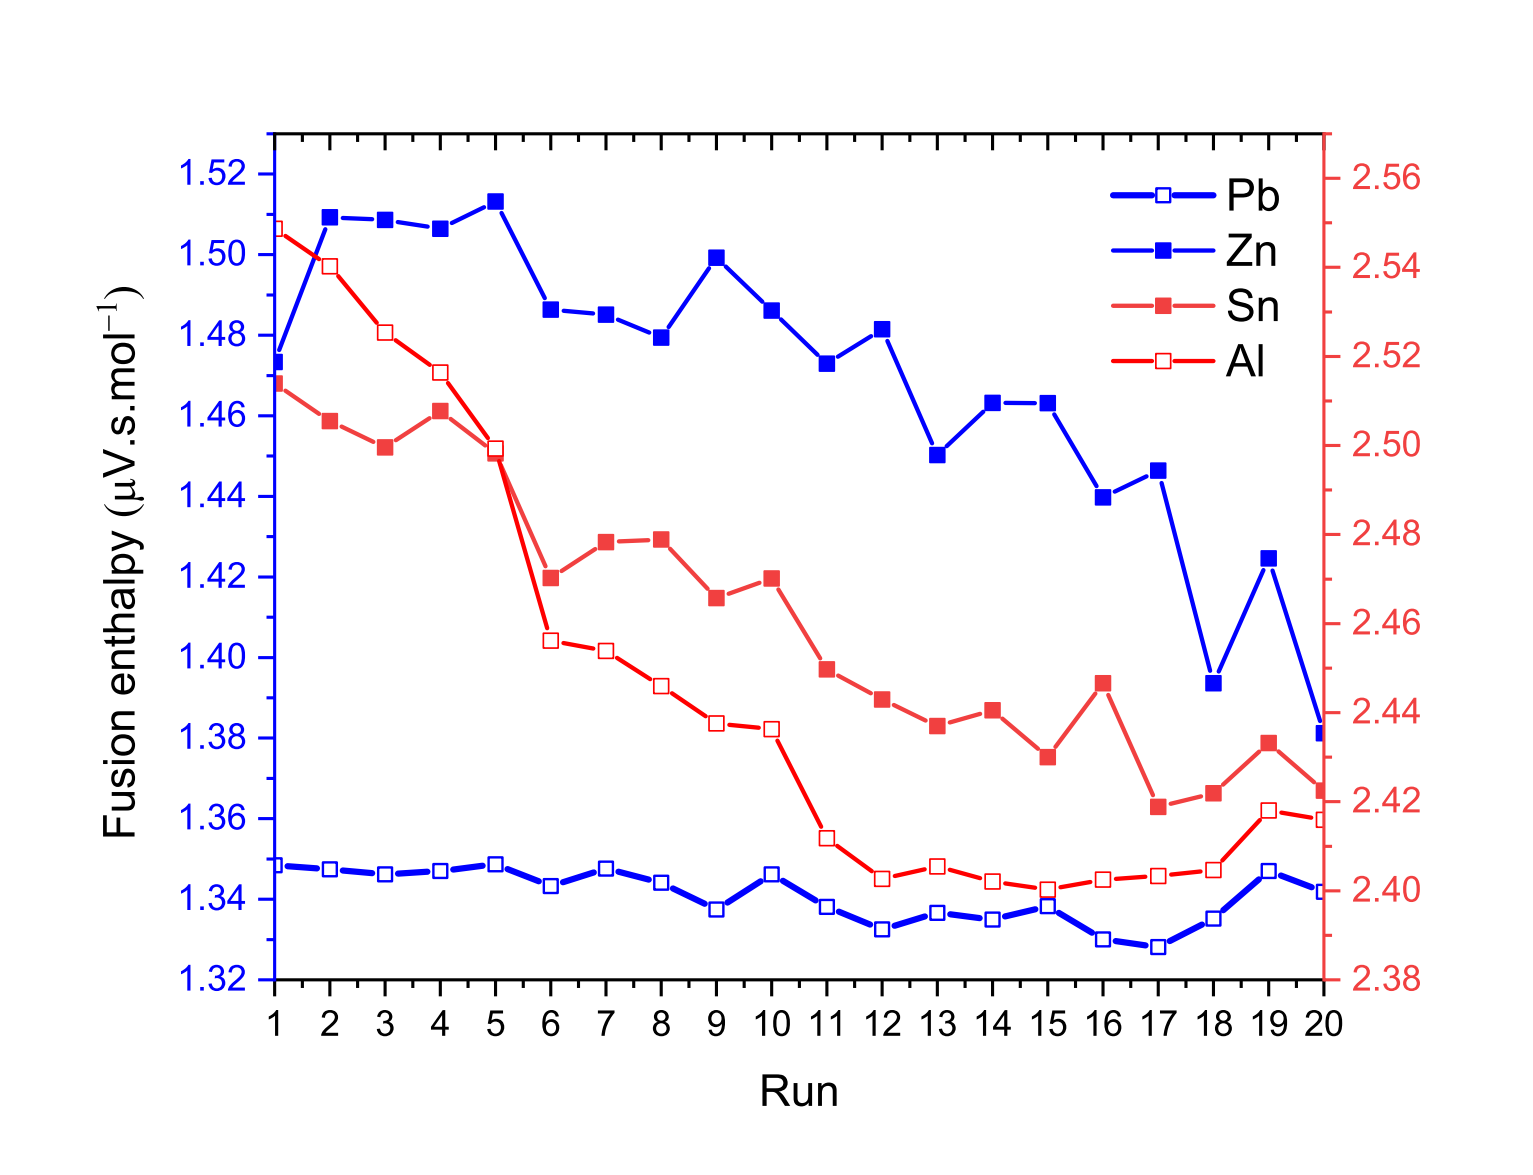
Figure 7: Cyclic DSC measurements of the fusion enthalpy of Pb, Sn, Zn and Al pure metals
Figure 6 clearly shows that the higher the affinity for oxygen is, the more the measurements are scattered. Just note that the obtained standards deviation for Pb fusion enthalpy measurements is very close to that of Ag. Thus, since Ag is the most noble tested metal, the obtained standard deviation of Ag and Pb may be regarded as the limit of the instrument.
Our hypothesis on this is that air could remain trapped in the crucible during the experiment. Above the melting temperature of the metal, an oxidation reaction may occur, promoted by the combination of relatively high temperatures and the higher reactivity of the metal liquids. Thus, after each melting, less and less metal is available for the endothermic melting reaction. In addition, the metal is wrapped in the newly formed oxide layer, which can decrease the thermal conductivity. This hypothesis is supported by the fact that the measured values of the fusion enthalpy decrease as the experiment progresses as reported in Fig. 7, although successive fusions should improve the quality of contact between the metal sample and the crucible, thus promoting better heat transfer. This is particularly pronounced for measurements on zinc, tin and aluminum, which have a relatively high affinity for oxygen. The main difficulty is therefore the following: to have reliable measurements of the fusion enthalpy of materials with a high affinity for oxygen, one may be tempted to keep the sample above the melting temperature in order to use all the available oxygen. However, as the oxidation reaction occurs, the uncertainty in the mass of the metal sample increases, since the overall mass is that of the metal and the newly formed oxide. Therefore, the only recommendation would be to be able to carry out the sample preparation and the experiment under a controlled atmosphere by placing the material in a silica tube sealed under argon for instance.
Finally, we noticed that continuous mass measurements carried out using the Labsys Evo balance show an overall increase in mass of about 1 mg for Sn, Pb and Al and an overall decrease in mass of 4.5 mg for Zn. These results are therefore in disagreement with the mass measurements carried out before and after the experiment with our precision balance, which show no variation.
2.4 Sample mass and shape
This problem arose when we tried to check the reliability of the DSC calibration, measuring several times to fusion enthalpy of pure metals. In Fig. 8, we have reported the DSC measurement of the fusion enthalpy of two pure silver wires with different mass (51.2 mg and 95.2 mg). After a first melting, the measurements were performed from 1173 K to 1273 K with a 5K/min step for both samples. Note that Fig. 8 represent the raw data. In order to make the graphical reading easier, simply note that the two measurements have been shifted so that the baselines before the peak overlap. 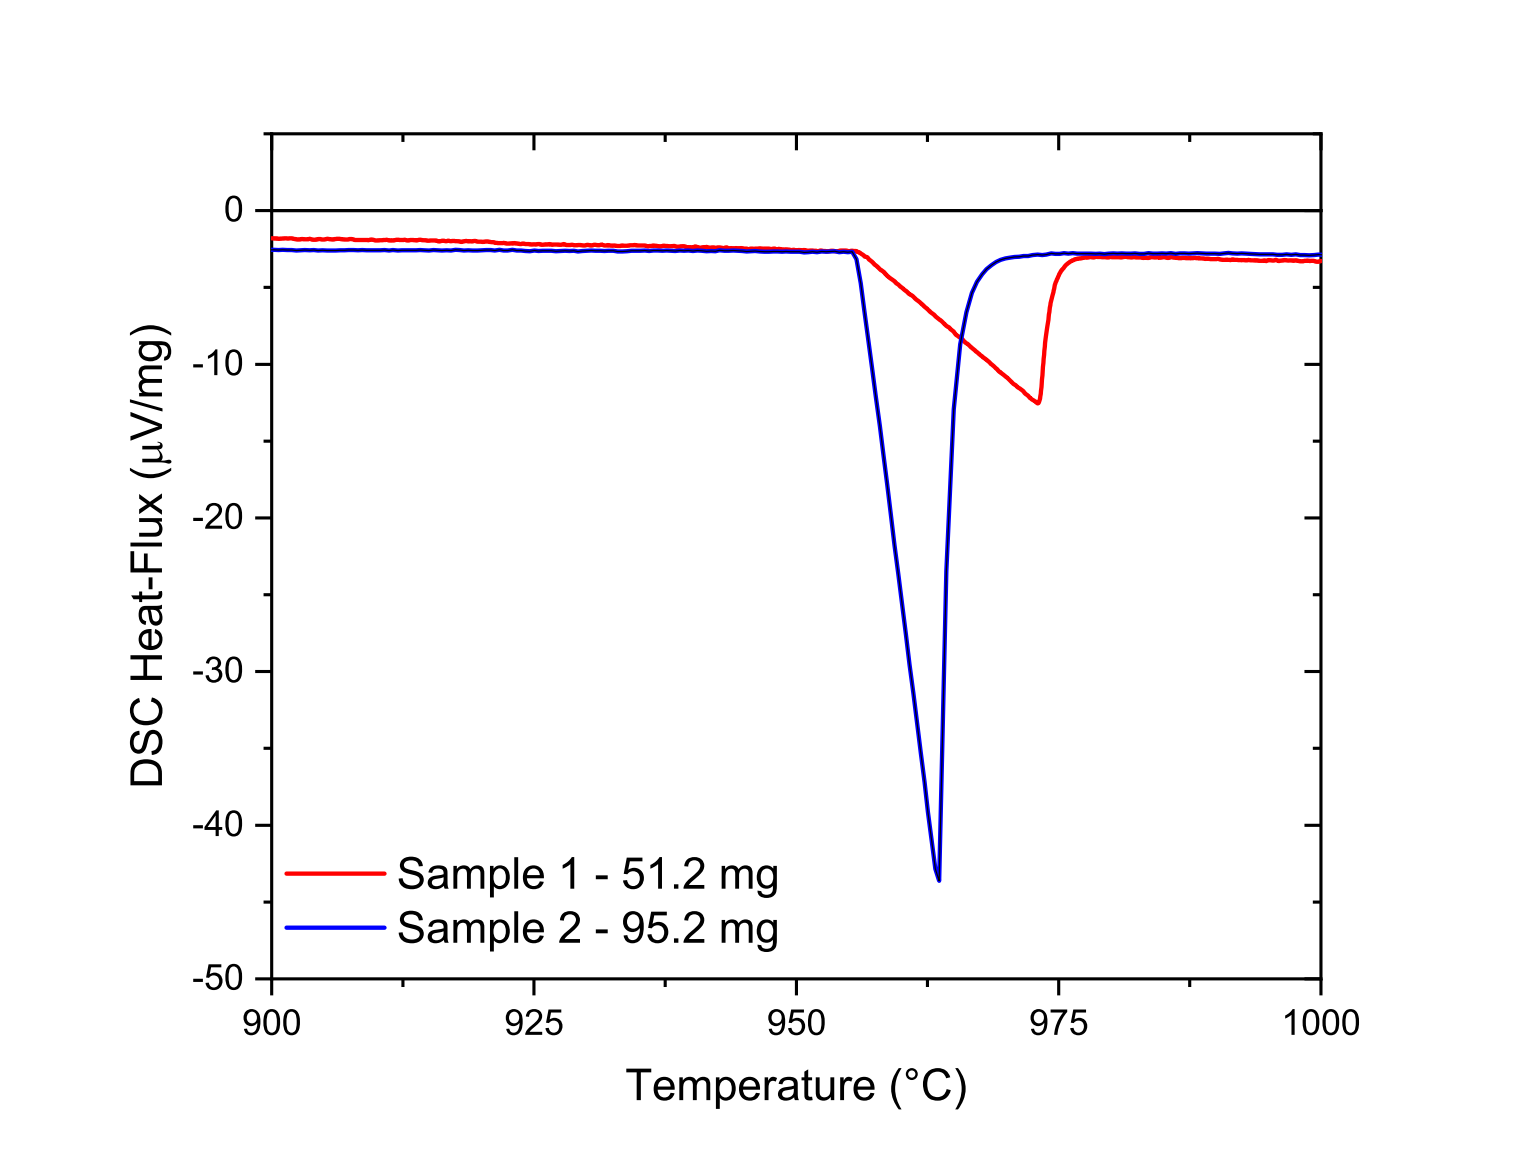
Figure 8: DSC measurement of the fusion enthalpy of silver wires from 1173 K to 1273 K with a 5K/min step
At first, note that it is quite surprising that the initial and final temperatures of the endothermic peak are different. Indeed, for the lightest sample, a difference of 25.6 K is observed between the beginning and the end of the peak, while for the heavier sample, this difference is only 15.8 K which is unexpected since the heat rate is the same for these two samples. In addition, due to thermal inertia effects, we might have expected to measure a larger peak difference for larger masses. At last, note that the integration of the two peaks normalized by the mass of the sample gives very different fusion enthalpies. The fusion enthalpy of the heavier sample is 28 percent higher than that of the lighter sample. We believe this is due to the contact between the pure metal wire and the crucible. Therefore, the shape of the sample plays a major role in the reliability and reproducibility of the measurements. Blanco [29] discussed the effect of the mass and shape of the samples used for reliable and reproducible measurements. He thus recommends the use of pellets obtained by powder pressing. The pellets must fit perfectly into the shape of the crucibles to minimize thermal gradients within the crucible. Nevertheless, Blanco pointed out that the packaging density of the powders has to be optimized in order to control the thermal conductivity. Indeed, this influences the presence of air between the particles and can thus decrease the thermal conductivity of the sample. It also should be noted that the average size of the particles may play an important role on the phase transformation temperatures. At last, since we pointed out the role of oxygen affinity in the accuracy of the DSC measurements, metallic powders can only be used when the samples analyzed are not sensitive to oxidation.
3. Conclusions
This report has been written from the point of view of a user beginning his expertise in TG, DTA, DSC and Cp measurements. We have thus reported several unexpected measurements that are difficult to explain at first glance, such as the non-flat heat flow signals for DTA and DSC blank measurements.
In addition, we explained the influence of temperature on the variation of the mass signals, which had been little studied in the literature. Moreover, we were able to show that a link seems to exist between the dispersion of DSC measurements of the fusion enthalpy of pure metals and their oxygen affinity. Finally, it should be noted that accurate DSC measurements can only be achieved by strictly controlling the shape sample.
References
- B. D. Mitchell, A. Knight, The application of differential thermal analysis to plant materials, Journal of Experimental Botany 16 (1965) 1-15.
- K. Honda, On a thermobalance, The Science Reports of the Tohoku Imperial University, Series II (1915) 97-103.
- M. ONeill, The analysis of a temperature-controlled scanning calorimeter., Analytical Chemistry 36 (1964) 1238-1245.
- T. Ozawa, Thermal analysis|review and prospect, Thermochimica Acta 355 (2000) 35-42.
- S. L. Simon, Temperature-modulated differential scanning calorimetry: theory and application, Thermochimica acta 374 (2001) 55-71.
- B. Wunderlich, A. Boller, I. Okazaki, K. Ishikiriyama, Heat-capacity determination by temperature-modulated dsc and its separation from transition effects, Thermochimica acta 304 (1997) 125-136.
- S. Shaw, C. Henderson, B. Komanschek, Dehydration/recrystallization mechanisms, energetics, and kinetics of hydrated calcium silicate minerals: an in situ tga/dsc and synchrotron radiation saxs/waxs study, Chemical Geology 167 (2000) 141-159.
- V. Van Essen, H. Zondag, R. Schuitema, W. Van Helden, C. Rindt, Materials for thermochemical storage: characterization of magnesium sulfate, in: Proceedings Eurosun, 2008.
- A. Douy, M. Capron, Crystallisation of spray-dried amorphous precursors in the sro{al2o3 system: a dsc study, Journal of the European Ceramic Society 23 (2003) 2075-2081.
- Y. Peng, D. J. Gardner, Y. Han, A. Kiziltas, Z. Cai, M. A. Tshabalala, Influence of drying method on the material properties of nanocellulose i: thermostability and crystallinity, Cellulose 20 (2013) 2379-2392.
- J. Ferrasse, P. Arlabosse, D. Lecomte, Direct total heat of desorption measurement from coupled tga-dsc analysis, in: Adsorption Science and Technology, World Scientific, 2000, pp. 366-370.
- B. Azambre, L. Zenboury, A. Koch, J. Weber, Adsorption and desorption of no x on commercial ceria-zirconia (ce x zr1- x o2) mixed oxides: A combined tga, tpd-ms, and drifts study, The Journal of Physical Chemistry C 113 (2009) 13287-13299.
- D.-Y. Wang, C.-L. Chang, W.-Y. Ho, Oxidation behavior of diamond-like carbon films, Surface and Coatings Technology 120 (1999) 138-144.
- V. Berbenni, A. Marini, Oxidation behaviour of mechanically activated mn3o4 by tga/dsc/xrpd, Materials research bulletin 38 (2003) 1859-1866.
- Y. Kong, J. Hay, The enthalpy of fusion and degree of crystallinity of polymers as measured by dsc, European Polymer Journal 39 (2003) 1721-1727.
- C. Rathgeber, L. Miro, L. F. Cabeza, S. Hiebler, Measurement of enthalpy curves of phase change materials via dsc and t-history: When are both methods needed to estimate the behaviour of the bulk material in applications?, Thermochimica Acta 596 (2014) 79-88.
- V. Mathot, M. Pijpers, Heat capacity, enthalpy and crystallinity of polymers from dsc measurements and determination of the dsc peak base line, Thermochimica acta 151 (1989) 241-259.
- C. Cerdeirina, J. Miguez, E. Carballo, C. Tovar, E. De la Puente, L. Romani, Highly precise determination of the heat capacity of liquids by dsc: calibration and measurement, Thermochimica acta 347 (2000) 37-44.
- H. Wiedemann, G. Bayer, Application of simultaneous thermomicroscopy/dsc to the study of phase diagrams, Journal of thermal analysis 30 (1985) 1273-1281.
- W. Gkasior, B. Onderka, Z. Moser, A. Dkebski, T. Gancarz, Thermodynamic evaluation of cu-li phase diagram from emf measurements and dta study, Calphad 33 (2009) 215-220.
- A. Karathanasis, Thermal analysis of soil minerals, Methods of Soil Analysis Part 5|Mineralogical Methods 5 (2008) 117-160.
- W. J. Boettinger, U. R. Kattner, K.-W. Moon, J. Perepezko, NIST Recommended Practice Guide: DTA and Heat-Flux DSC Measurements of Alloy Melting and Freezing, Technical Report, 2006.
- H. Briehl, J. Butenuth, Application of dta/dsc and tg for studying chemical reactions of monomeric organic compounds, Thermochimica acta 167 (1990) 249-292.
- A. Bhattacharya, Optimization of firing parameters for ceramic wares by thermal analysis, Journal of thermal analysis 49 (1997) 1365-1371.
- J. A. Amkpa, N. A. Badarulzaman, Thermal conductivity of barkin-ladi fireclay brick as refractory lining, IOSR Journal of Mechanical and Civil Engineering 14 (2017) 1-5.
- ASTM-E1582-17, Standard test method for temperature calibration of thermogravimetric analyzers, ASTM International, West Conshohocken, PA (2014).
- ASTM-E967-18, Standard test method for temperature calibration of differential scanning calorimeters and differential thermal analyzers, ASTM International, West Conshohocken, PA (2018).
- ASTM-E968-02, Standard practice for heat flow calibration of differential scanning calorimeters, ASTM International, West Conshohocken, PA (2014).
- I. Blanco, The correctness of cp measurements by dsc, actions to do and not to do, Thermochimica Acta 685 (2020) 178512. doi:https://doi.org/10.1016/j.tca.2020.178512.
- J. Czarnecki, Precision thermogravimetry, Journal of Thermal Analysis and Calorimetry 120 (2015) 139{147. doi:10.1007/s10973-014-4384-0.
- P. Le Parlouer, Techniques et methodes thermogravimetriques pour la caracterisation de la reactivite des solides, 2011.
- C. W. Bale, P. Chartrand, S. Degterov, G. Eriksson, K. Hack, R. Ben Mahfoud, J. Melancon, A. Pelton, S. Petersen, Factsage thermochemical software and databases, Calphad 26 (2002) 189-228.
